The PC Hotspots Window
The “PC Hotspots” table lists the source code PC instructions where the application spends the most time. All timing data refers to the time range selected by the user. This time range can be: - the full simulation range if a “Zoom Fit” has been executed before - the Timeline range if different zooming in/out or scrolling operations have been performed before - the selected time interval if a specific time range has been selected by the user. For seeing all hotspots, the user must display the full simulation interval by clicking on the “Zoom Fit” button.
The hotspot information is displayed in different columns:
Time %: the percentage of time that has been spent on this particular PC instruction within the time range selected.
Total time: the total time that thas been spent on this particular PC instruction within the time range selected.
Calls: the number of times this line has been executed during the time range selected
Function name: the name of the function in which the hotspot occurs
From File: the name of the file where the hotspot occurs
On Line: the line number of the hotspot
PC Nb : The PC instruction nb where the hotspot occurs.
Fig 16 shows the Hotspots window.
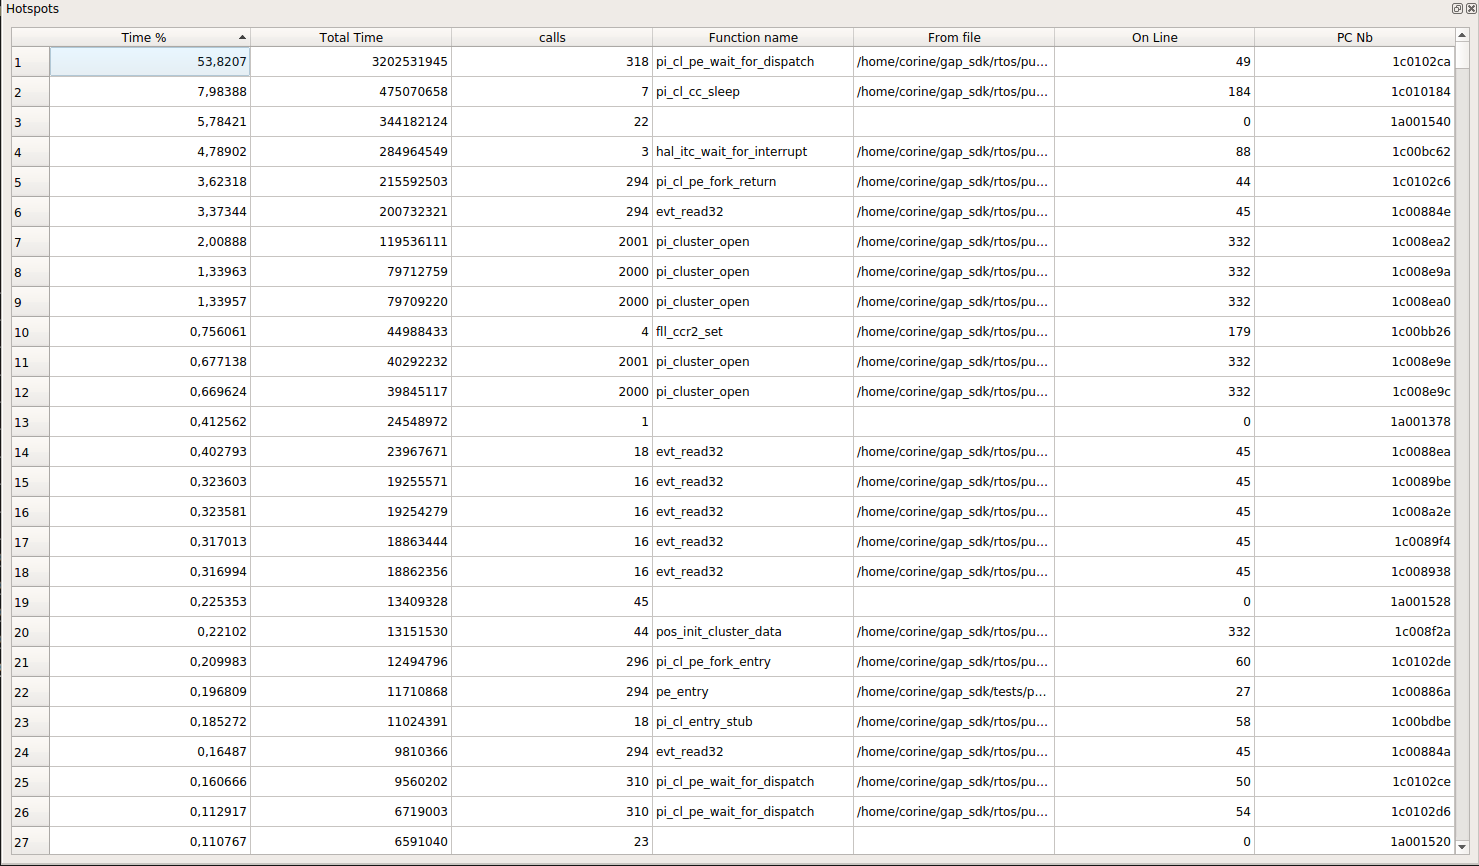
Fig 16: Hotspots Window
The PC Hotspots can be sorted by increasing or decreasing time % or total time by respectively right clicking in the “Time%” ot “Total Time” column headers. Idem for the #calls , line nb, etc.. They can also alphabetically sorted by function or file name by respectively right clicking in the “Function Name” or “File Name” columns headers.