Running the Profiler
Setup
Once you have launched an application and the Profiler’s window is opened, you can start configure your window.
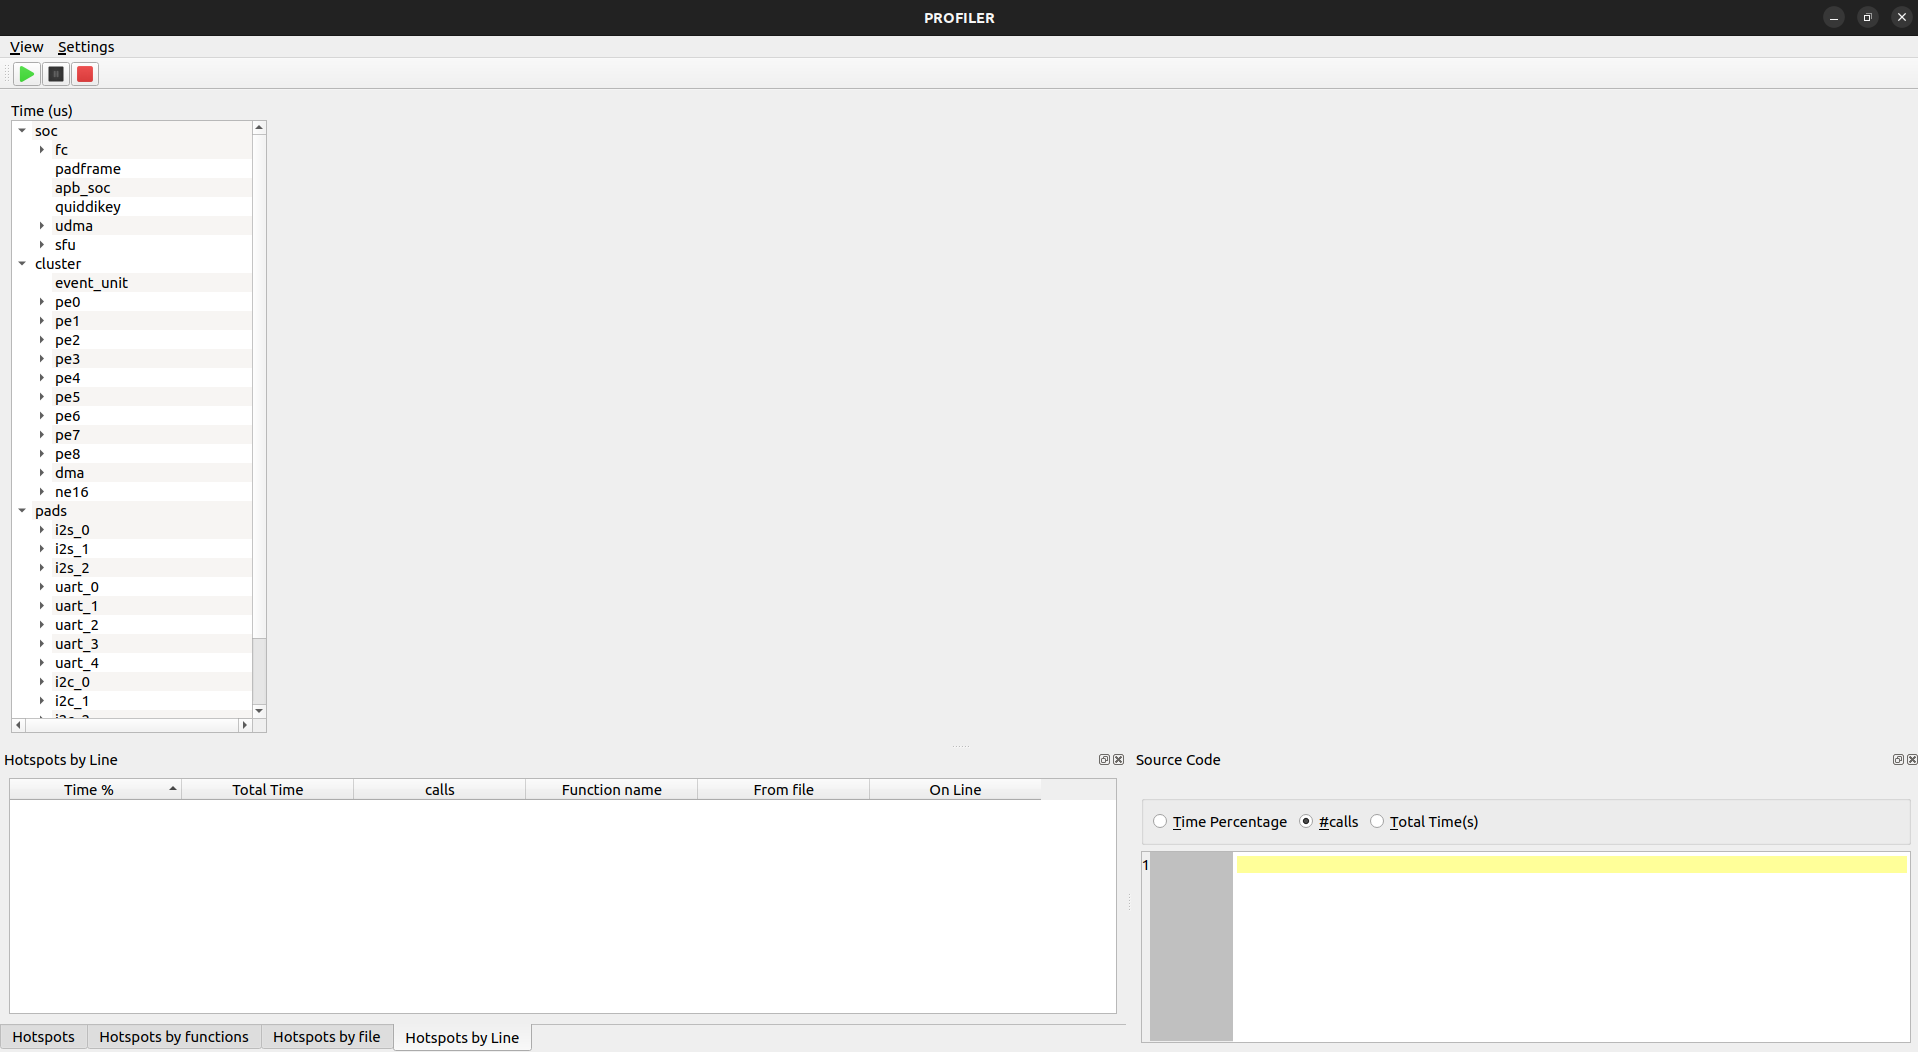
On the top left, the Settings menu allows you to select which group of signals you want to track during the simulation. Beware that the more the signals you select, the more the memory will be used. This will impact the speed of the simulation (slower) and its “depth”. There is a maximum number of events that you may reach faster with more signals tracked.
Next to it, the View menu allows you to select the windows you want. There is no impact on the simulation.
Running
The three square buttons on the top left allow you to start, pause, and stop, respectively, the simulation.
The waveform window should update itself during the simulation to get something like the following image:
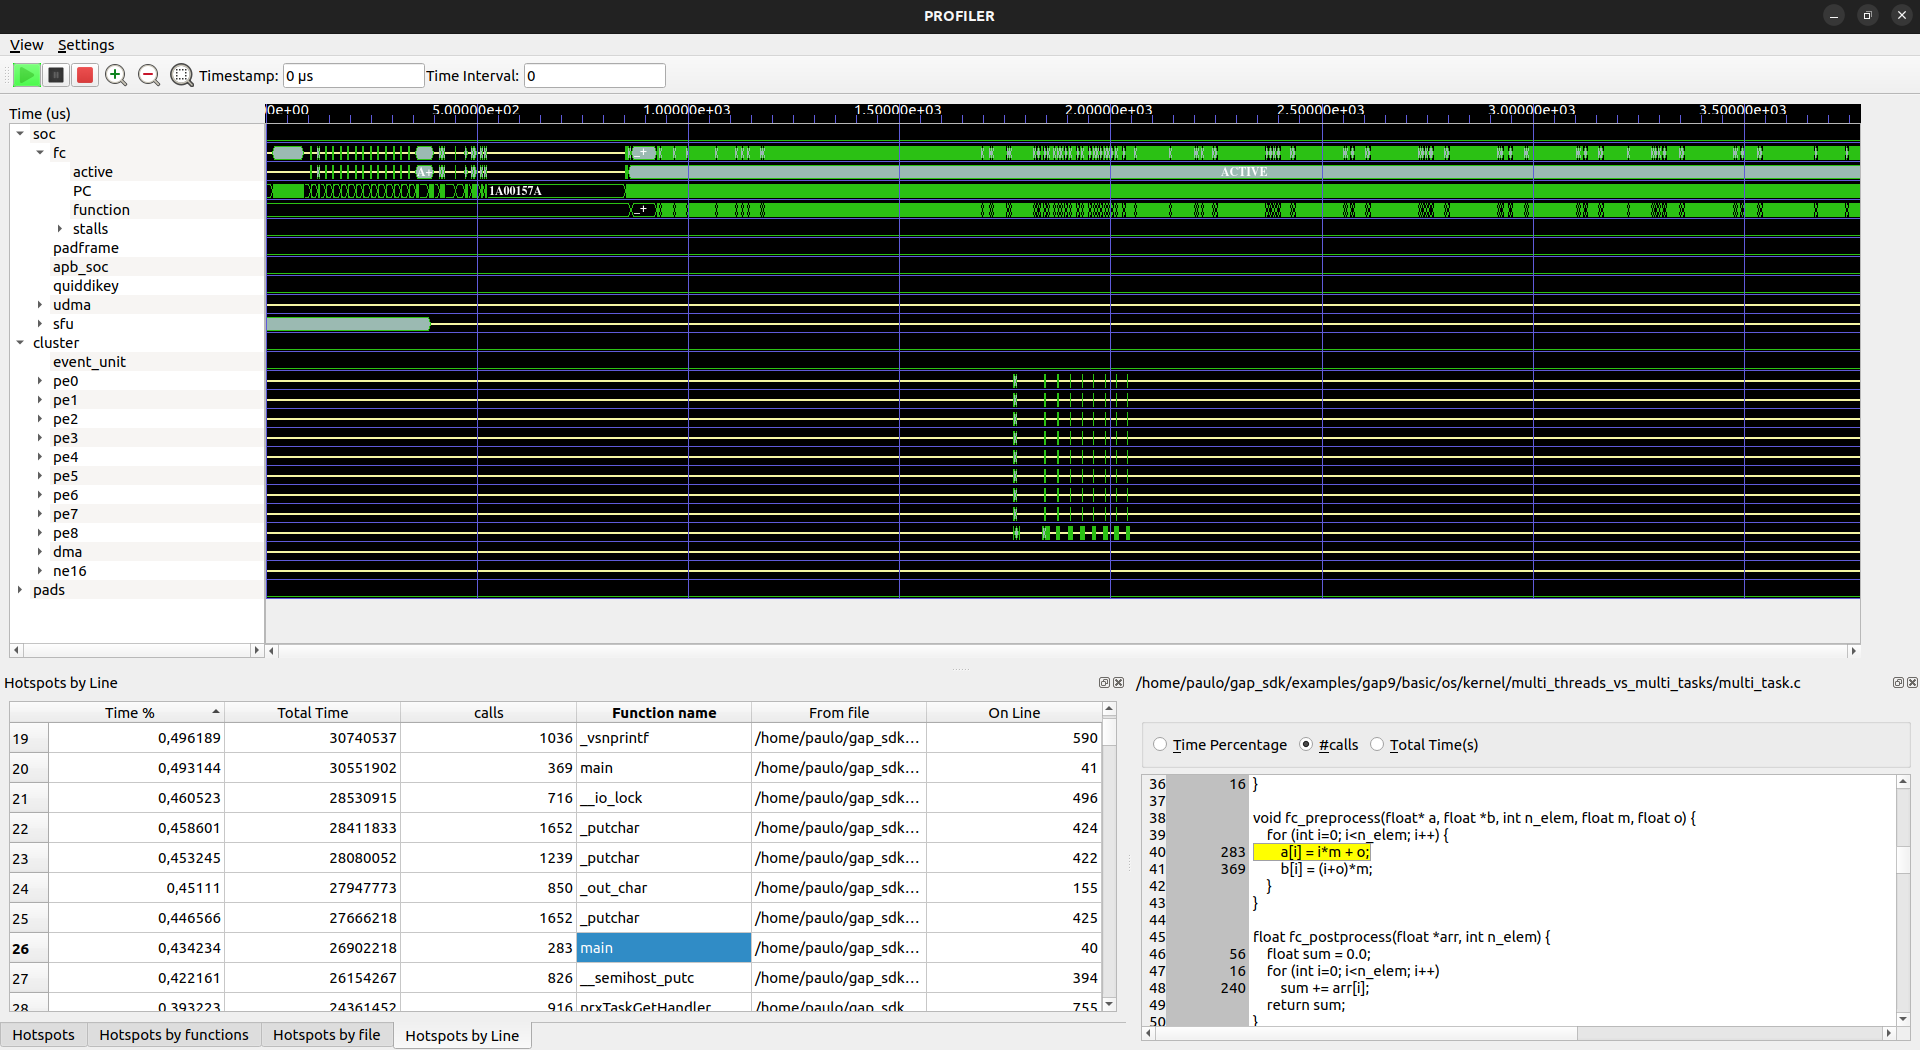
The three magnifying glass buttons on the right of the stop button allows you to zoom in, zoom out and fit, respectively, the zoom into the waveform.