Starting the GVSoC Simulation
To start the GVSoC simulation, just click on the green arrow button on the left of the actions bar. The simulation can be paused by clicking on the black square button. It can be continued by re-clicking on the green arrow.
The simulation can be cancelled by clicking on the red square button. It can be started again by clicking on the green arrow.
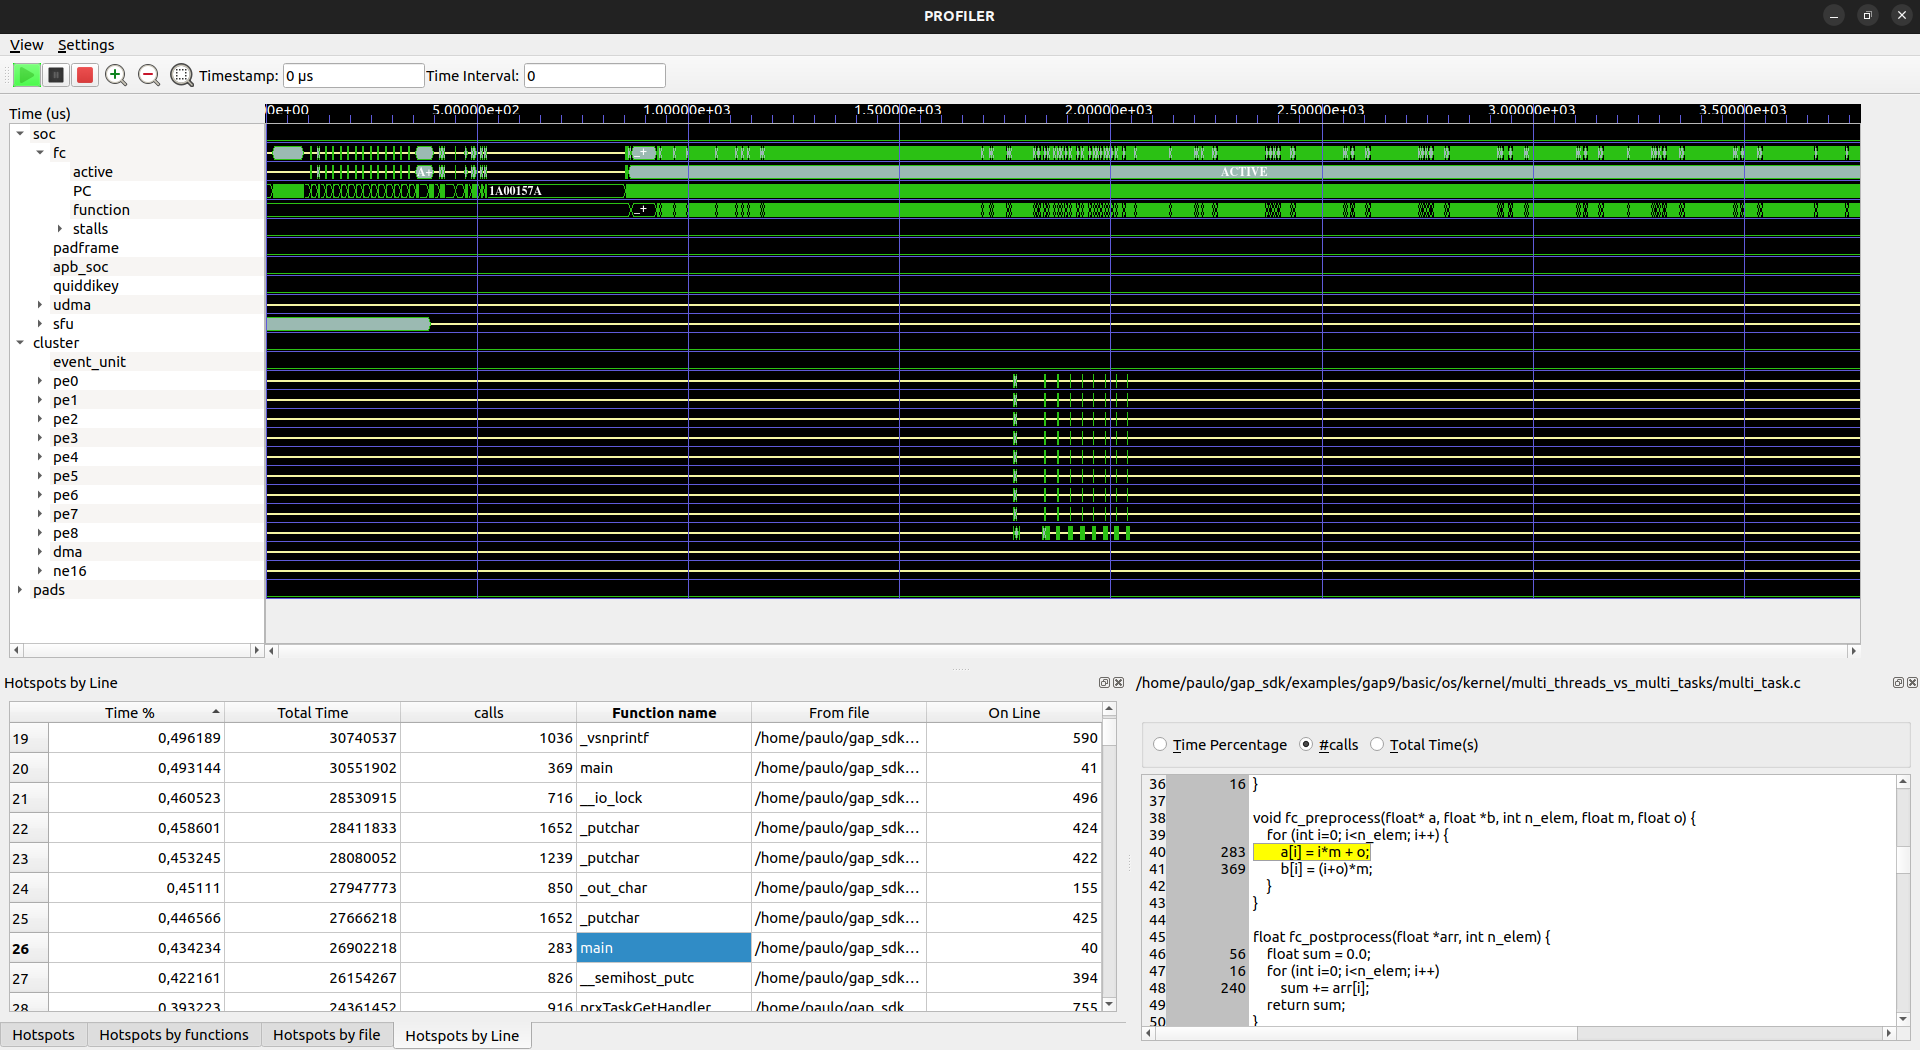
During the simulation, the GAP signals are displayed on the waveform as soon as they are transmitted by the GVSoC simulator. Two dock windows are simultaneoulsy displayed:
The Hotspots dock window with its different tab views (by time, by function, by file, by line);
The Source code dock window, that show the code pointing by the selected hotspot.