Profiling
Introduction
Profiling a simulated application with GVSOC is done using GTKWave. GVSOC can dump VCD traces that show the state of various components over time, such as core PCs, DMA transfers, etc., which can then be viewed graphically with GTKWave.
Usage
VCD tracing can be activated using the –vcd option:
gvsoc --target=rv64 --binary=test run --vcd
Once the platform runs, this generates two additional files in the working directory:
A VCD file called all.vcd containing all the signal values.
A GTKWave script called view.gtkw that sets up the view with the most interesting signals.
The runner will also display a message to open GTKWave with the generated script:
A Gtkwave script has been generated and can be opened with the following command:
    gtkwave build/view.gtkw
View Description
The view displayed from the GTKWave script is hierarchical and consists of two parts.
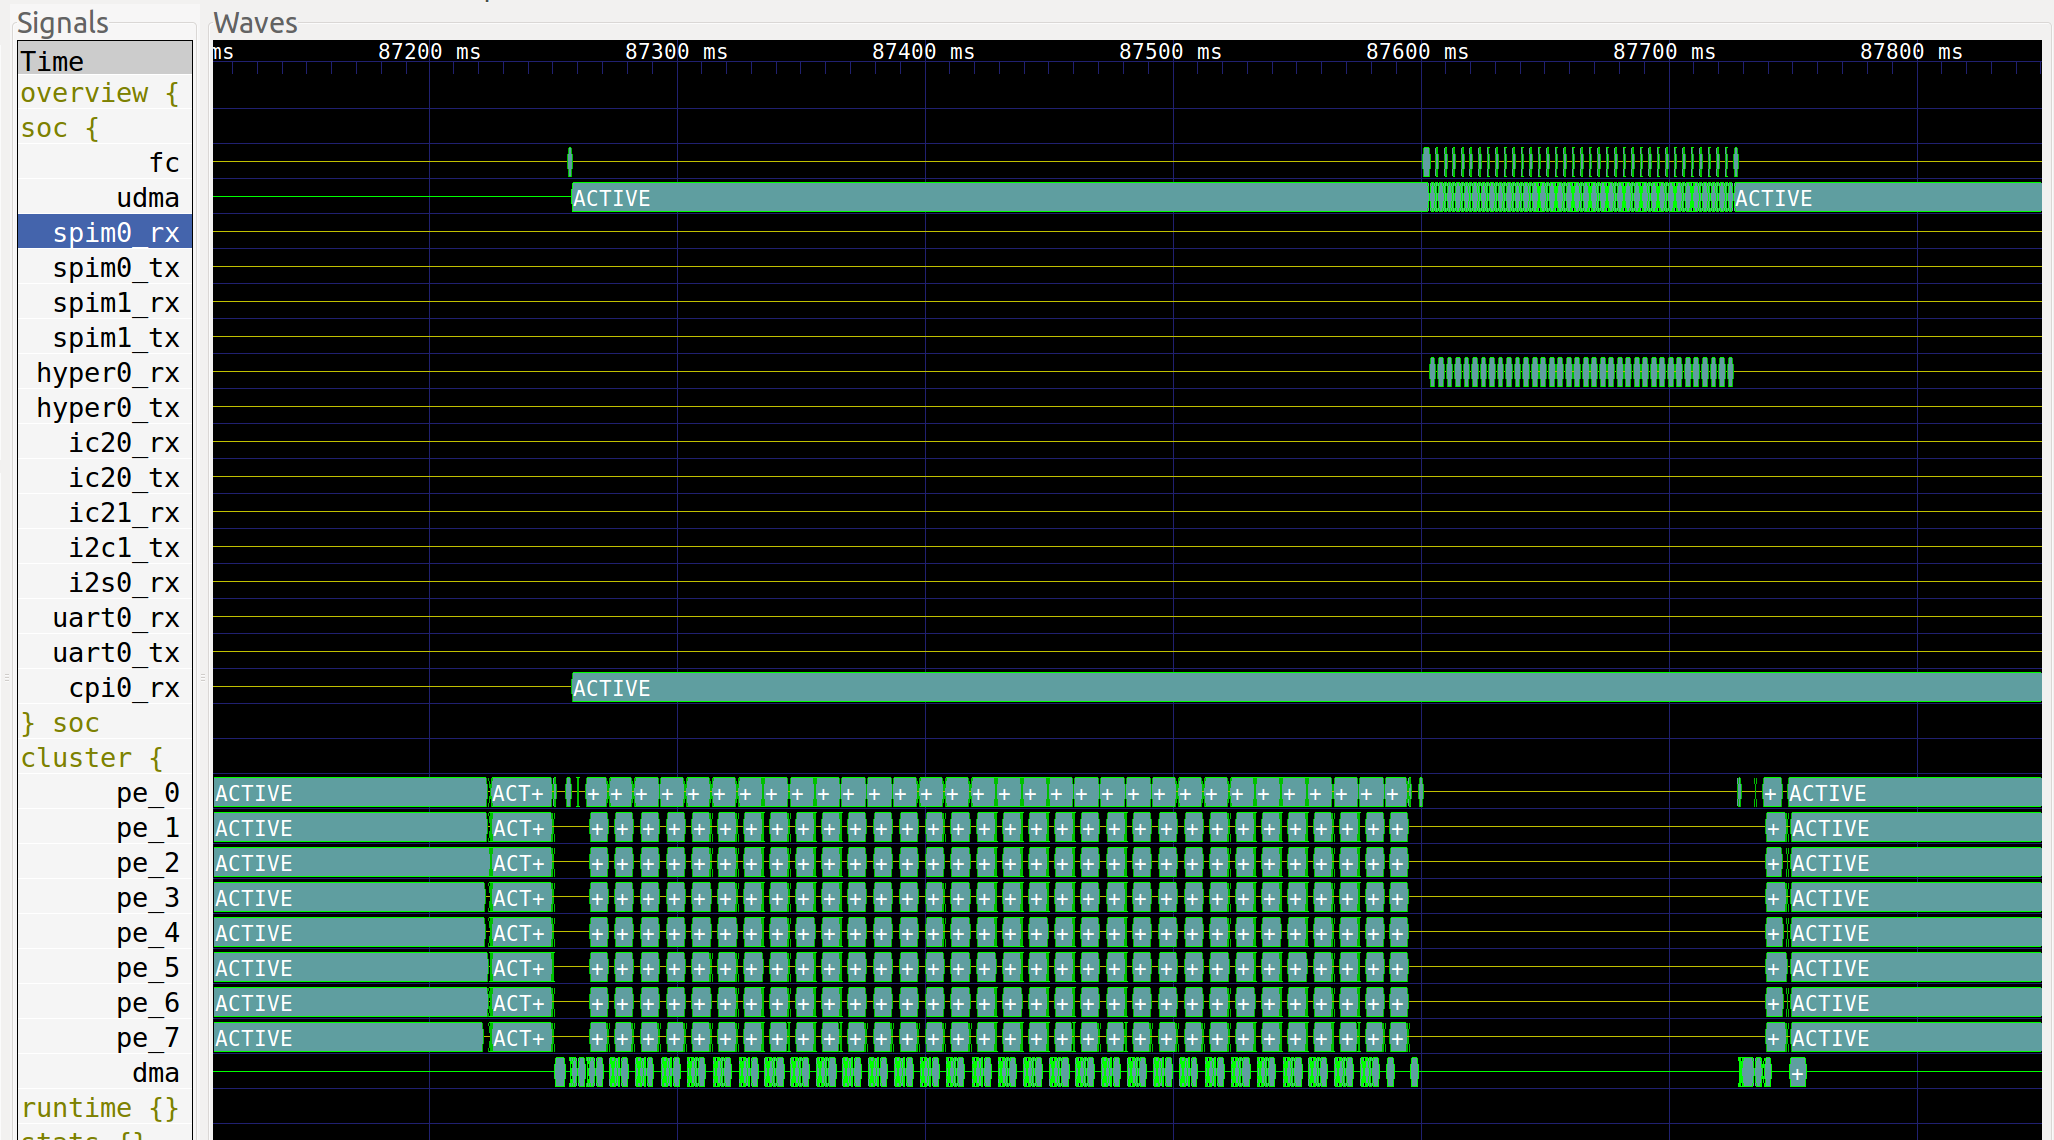
The first part is on the top (see the image below), under the group overview, and shows an overview of the execution with the most useful signals. It basically displays the state of each important block in the system, which is useful for quickly checking what is being executed across the whole system. Some groups in this part are closed by default and can be opened by double-clicking on them.
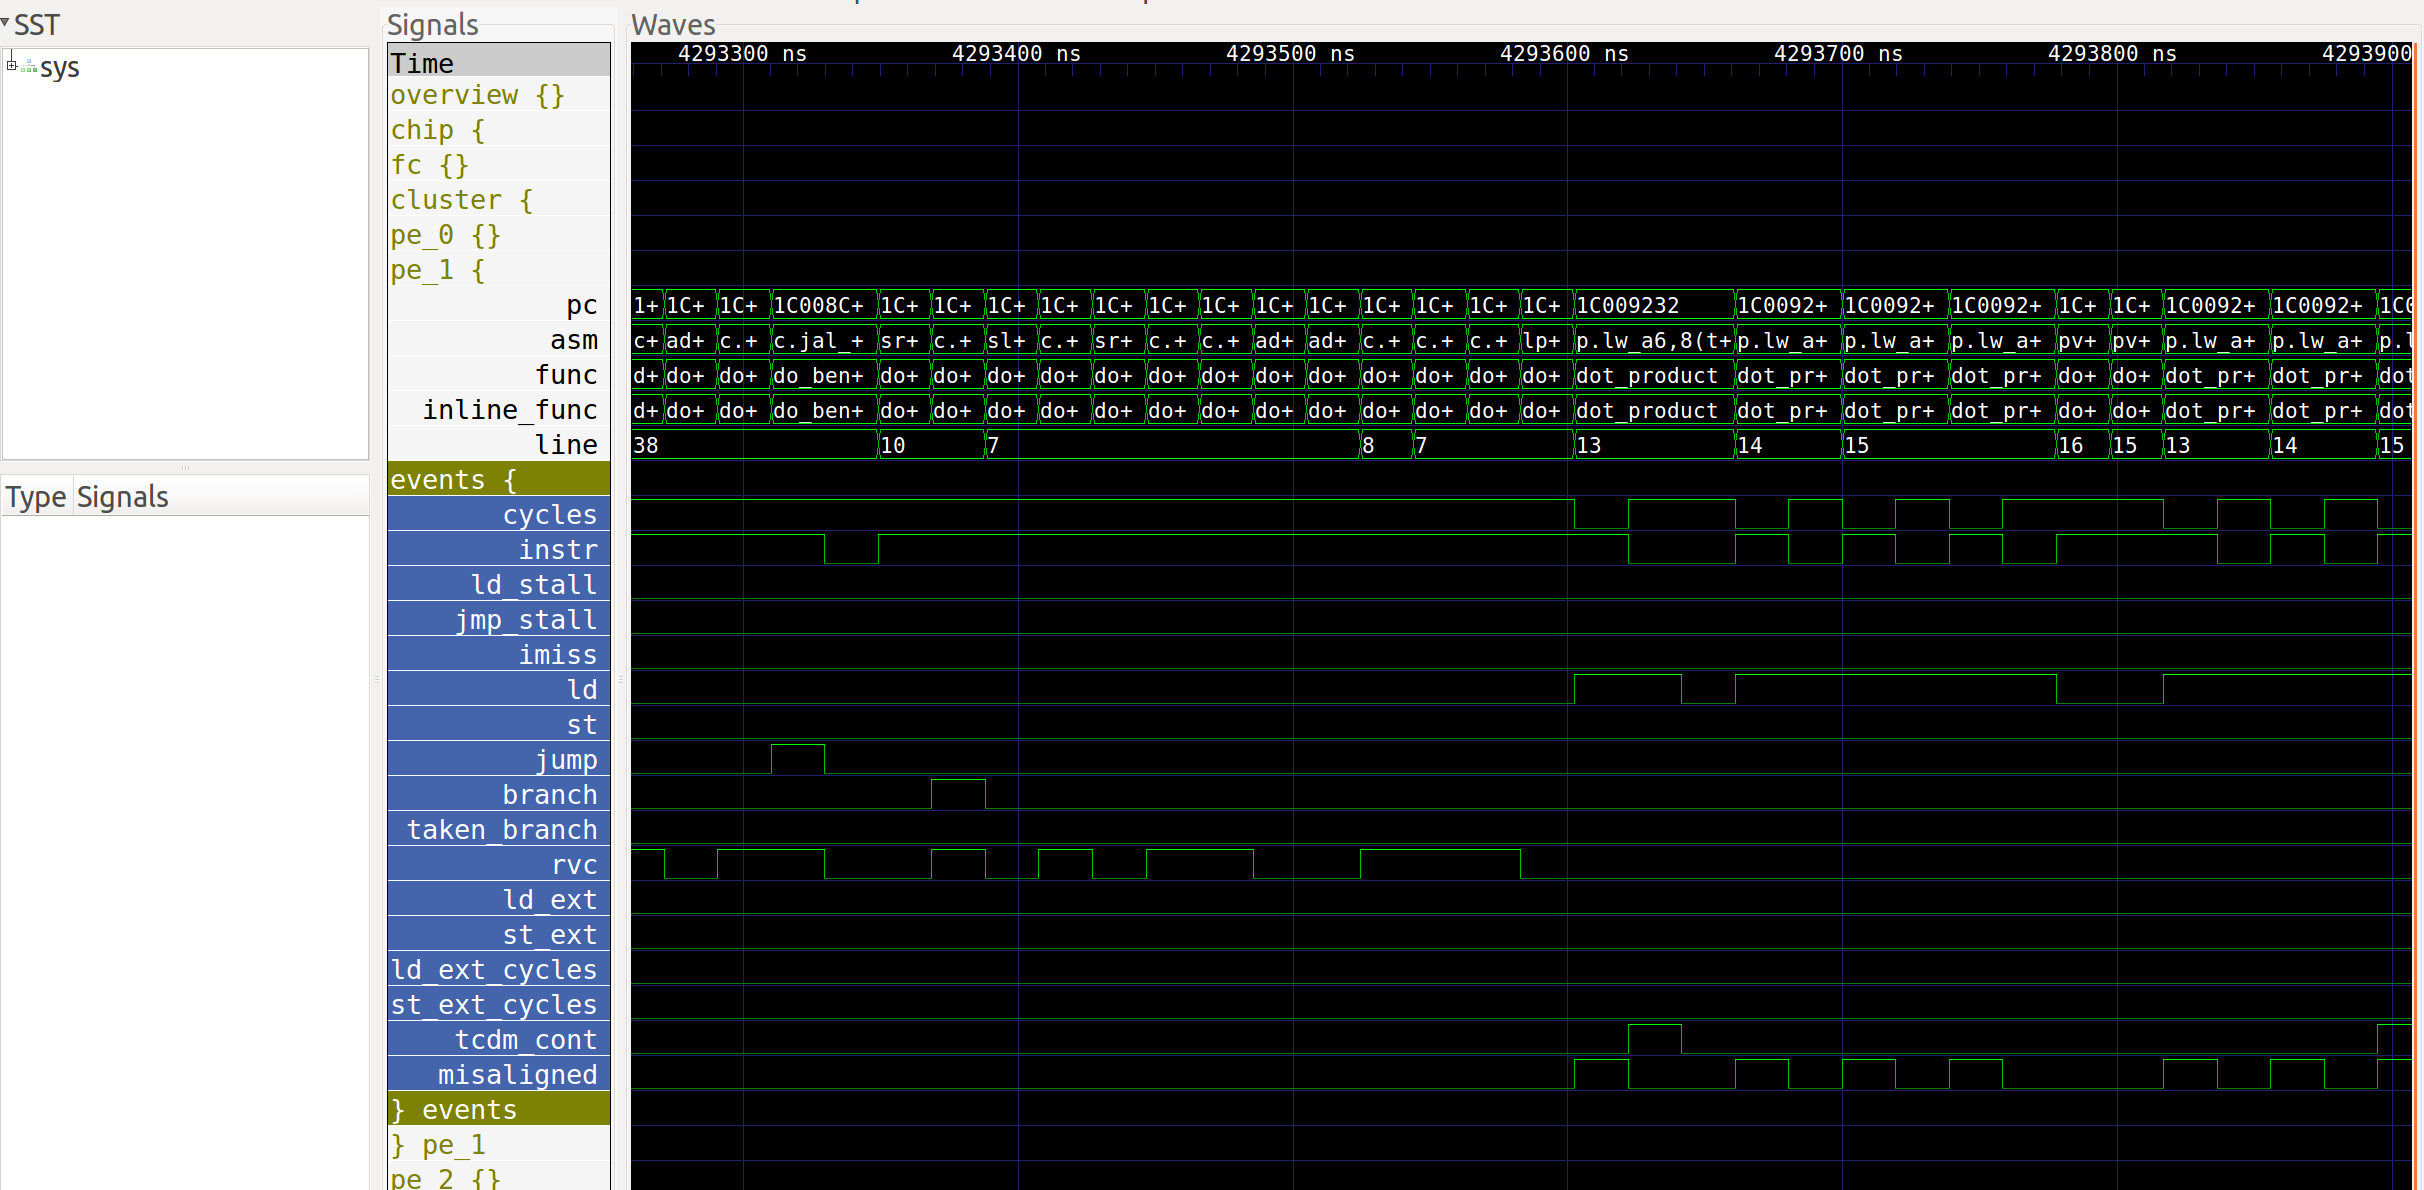
The second part (see the image below), under the group system, shows a more detailed view of the execution. Additional tags or traces can be specified. The program counter is shown along with debug information about the function being executed, the disassembled instructions, etc. For each core, a group called events contains information about the state of the core (stalls, loads, instructions, etc.), which helps to understand why a core is stalled.
Trace Selection
The –vcd option by default enables only a small number of traces to keep execution speed and trace file size reasonable while providing a good overview of the application.
More traces can be activated by specifying trace tags or names. Tags will activate a set of traces, while names will activate specific traces.
Tags can be activated with the option –event-tag=<name>. This option can be given several times to specify multiple tags. The tag overview is always selected by default. Other tags that can be selected include: debug, asm, pc, core_events, and clock.
Example:
gvsoc --target=rv64 --binary=test run --vcd --event-tag=debug --event-tag=core_events
Specific events can be selected with the option –event=<name>. This option can be given several times to specify multiple traces. Similar to system traces, the name is a regular expression that will be compared against the path of each trace. Any trace matching the regular expression will be enabled.
Example to activate all traces:
gvsoc --target=rv64 --binary=test run --vcd --event=.*