 |
GAP8 BenchMarks
|
 |
 |
GAP8 BenchMarks
|
 |
The GAP8 CNN Benchmark package provides a test suite to evaluate the performance and energy efficiency of GAP8's cluster on a representative subset of Convolution Neural Networks (CNN) Layers. This guide shows you how to run the benchmarks and check cycle and energy results.
Here the list of benchmarks in this test suite:
The benchmarks can be executed in 2 scenarios:
Each GAP8 Cluster core embeds a vector unit capable of 4 byte operations or 2 short operations per cycle*.
The performance and energy results measured on the GAPuino Board are reported in this section. In following sections we explain how to reproduce these results with your GAPuino Board.
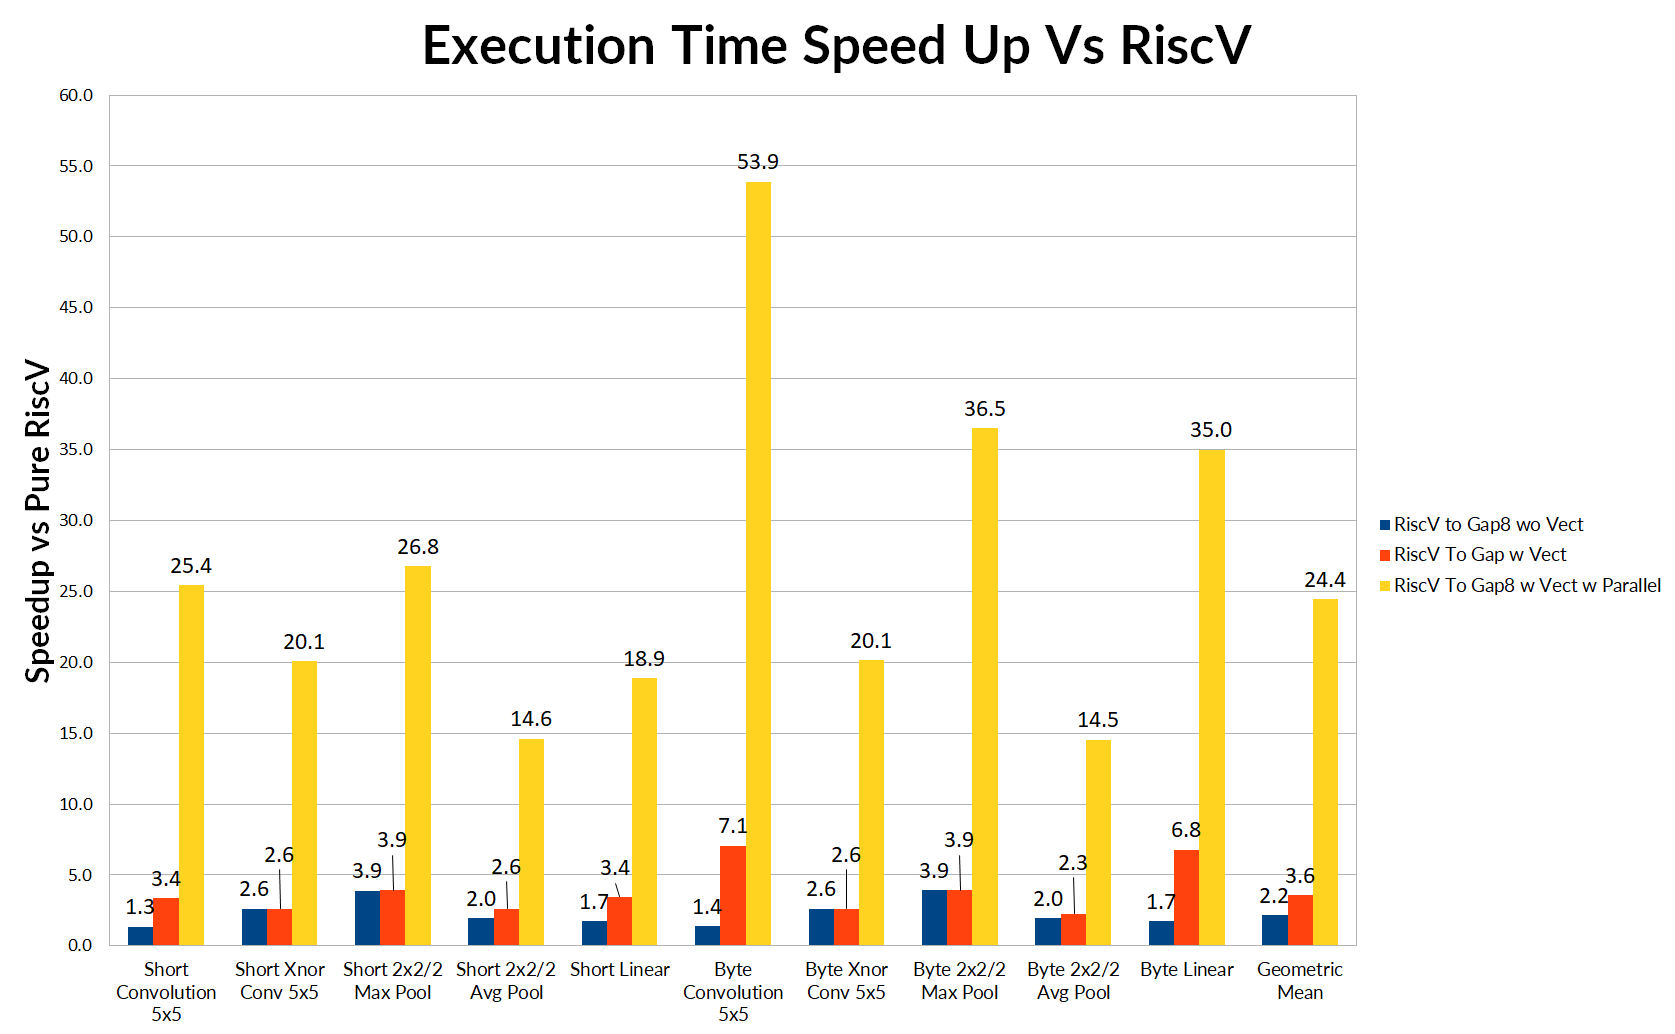
The following chart shows the execution time speed-up of GAP8. The baseline is the Pure RISC-V ISA. All the experiment were conducted on a GAPuino Board.

As we can see GAP8 benefits from all the 3 optimization steps. The speed up of GAP8 ISA extensions, vectorization and parallelization is between 14.5x and 53.9x. Which means that for instance at max GAP8 frequency for a 5x5 byte convolutional layer on a 112x112 grayscale input image with 100 output filters, on GAP8 it takes only 12.8 ms while on a single core standard RISC-V ISA 729.4 ms.
The next analysis shows the energy efficiency gain with respect to pure RISC-V Standard ISA.

Here the results shows that for a given benchmark, we have a benefit from the GAP8 ISA extensions (blue bar), from the vector units (red bar) and from parallelism (yellow bar). The parallelism, exploiting shared instruction cache and shared memory, gives an additional 2x gain in energy efficiency.
To run the benchmarks with RISC-V Std ISA + Gap8 ISA extensions you can just type:
This will be the output that you get:
To switch input data between Byte and Short a define has been placed at beginning of AllTest.c file. Comment it out to test it with shorts.
To change the number of iterations executed by each benchmark you can change the value of this define:
To change Fabric Controller and Cluster Frequencies you can use following defines. Both of then can be powered at 1 or 1.2 Volts.
Here is a table of the supported maximum frequencies:
| Input Voltage | Fabric Controller Max Freq | Cluster Max Freq |
|---|---|---|
| 1.0 V | 150 MhZ | 90 MhZ |
| 1.2 V | 250 MhZ | 175 MhZ |
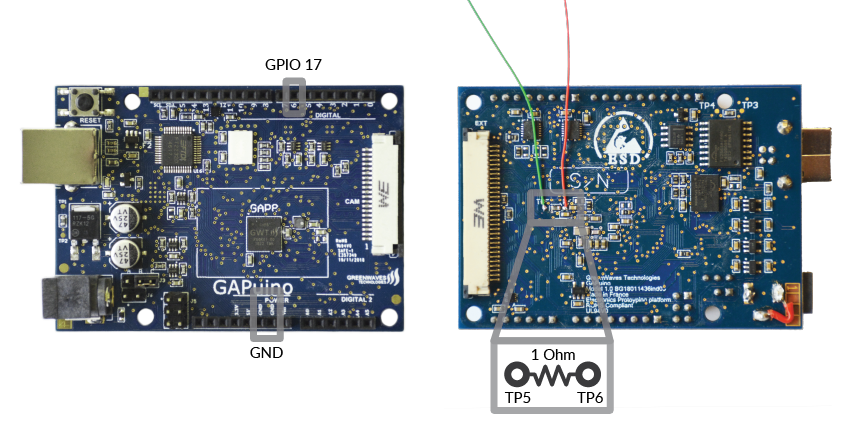
The energy consumed by each benchmark can be measured using a differential probe connected to an oscilloscope. The differential probe is connected to the tests point 5 and 6 (TP5 and TP6). A 1 Ohm resistor is already placed between the two test points on the board. Before each kernel is launched the benchmark asserts the GPIO 17 and once each single benchmark is finished de-asserts it. So this GPIO can be used as trigger for the energy measurements. In the following figure a description of the physical pins on Gapuino board:

To enable the GPIO PIN this define should be commented out:
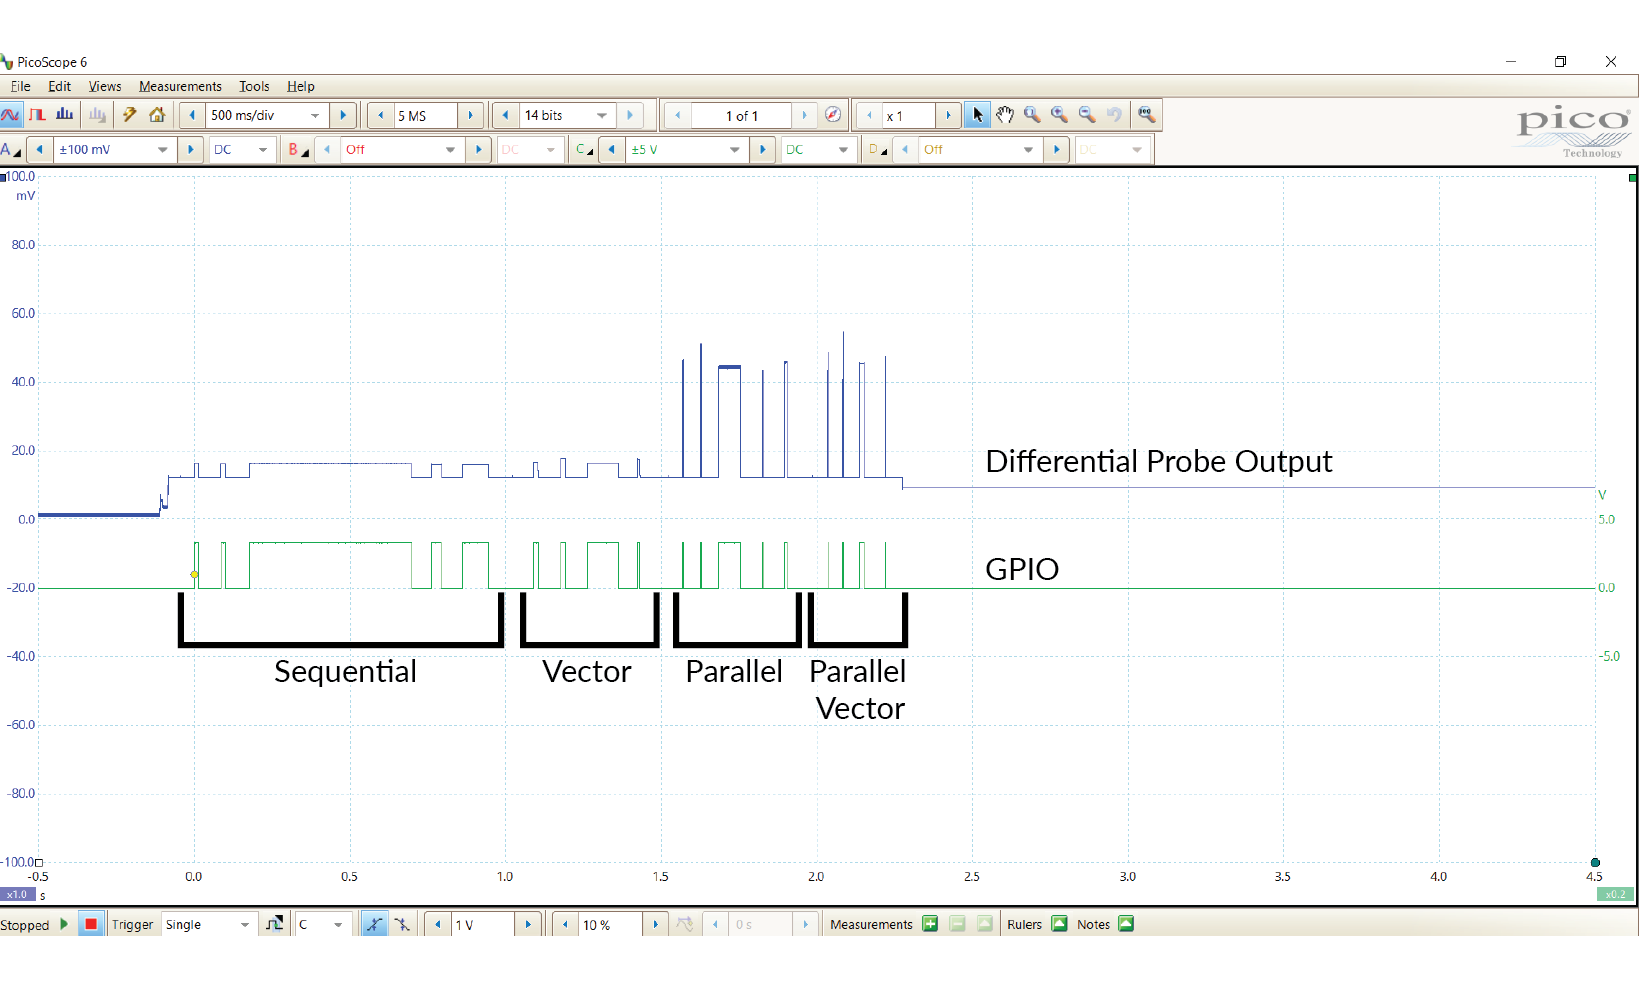
The results presented in the previous section are sampled with a PicoScope 4444 using 1 probe connected to GPIO 17 and 1 differential probe to measure the voltage drop. The voltage drop can be directly converted to current thanks to the 1 Ohm resistor (I = V / R, where R is 1).
Here an example of the PicoScope output screen of the benchmarks:

The GPIO indicates the starting and ending point of each benchmark.